[R] 결손치를 히스토그램에 나타내는 방법
2008-07-07
R-Tips
기본 R의 histgram에서는 결손치(NA)를 그래프에 표시하지 않는다. 결손치의 수를 그래프에 나타내기 위해서는 약간의 추가 과정이 필요하다.
> sample.data <- as.factor(sample(c(1, 0, NA), 100, replace = TRUE))
> sample.data <- as.character(sample.data)
> sample.data[is.na(sample.data)] <- " NA"
> sample.data <- factor(sample.data)
> plot(sample.data)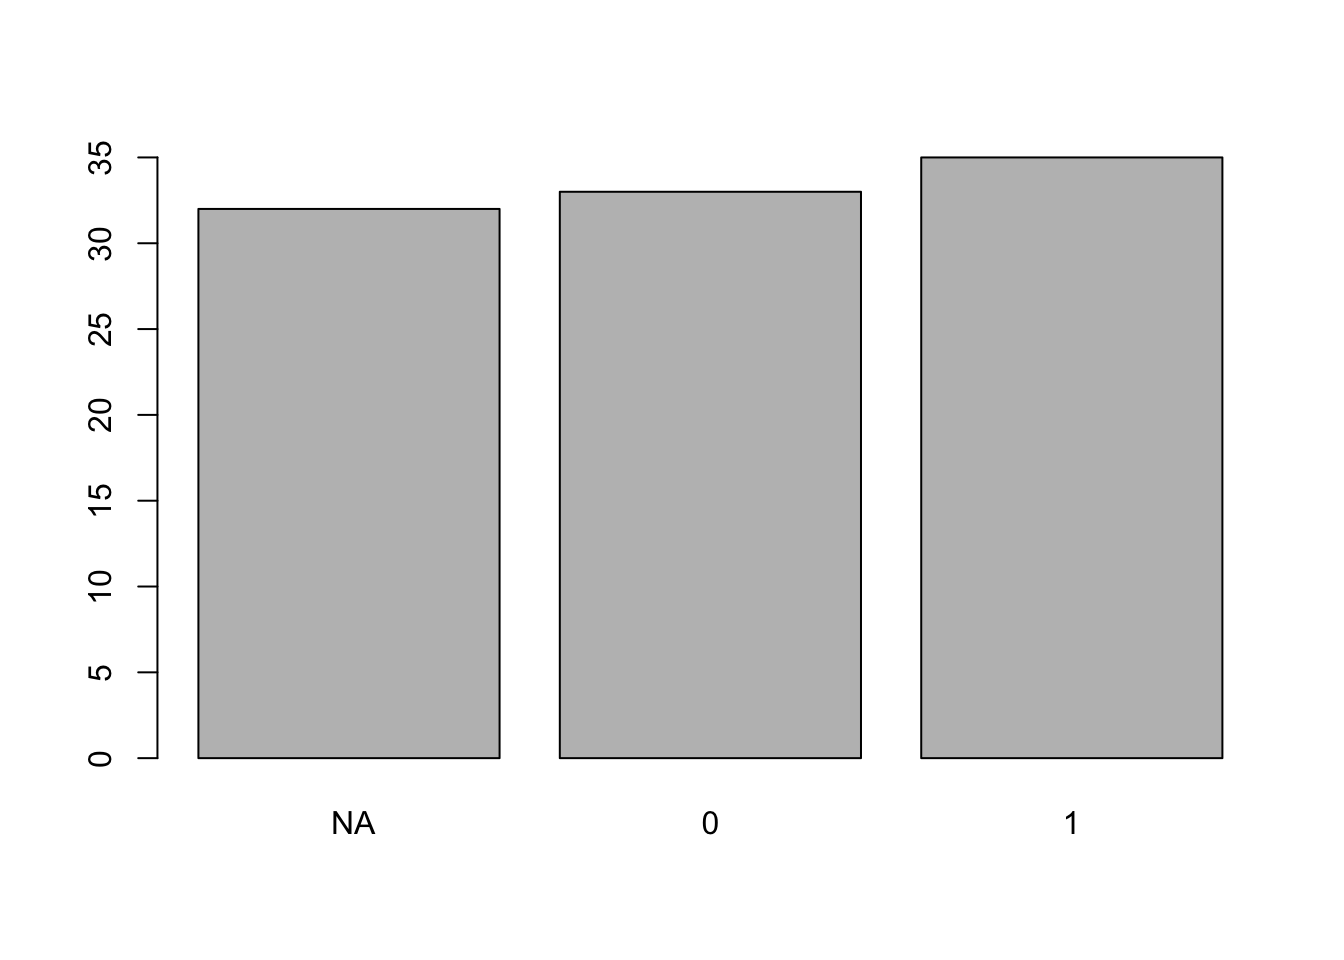
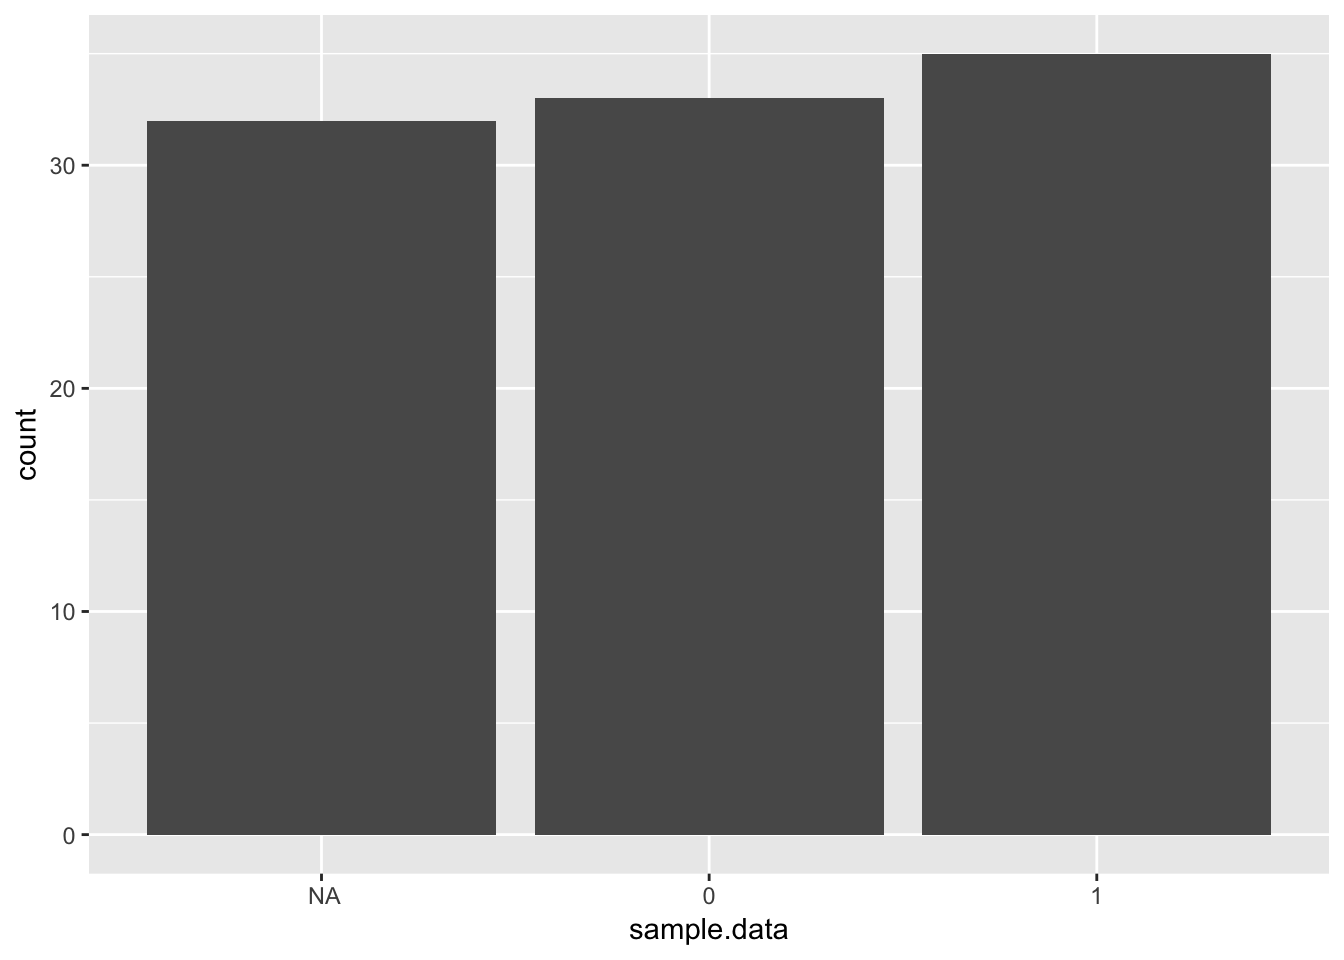
ggplot2 패키지를 이용하면 좀더 멋진 그래프를 얻을 수 있다.
> library(ggplot2)
> ggplot(data = NULL, aes(x = sample.data)) +
+   geom_histogram(stat = "count")